
Data Strategy, Business Intelligence & Analytics · Professional service
Turn fragmented data into trusted metrics and actionable decisions
Connect fragmented data, establish trusted metrics, and turn reporting into informed action.
We help organizations define KPIs, improve data quality, connect source systems, build reliable BI, and produce analysis that supports operational, growth, and executive decisions.
Analytics strategy and KPI design Data engineering and quality BI, analysis, and decision support
Last reviewed:

Data strategy, business intelligence, and analytics
Data analytics services for trusted metrics, BI, and decision support
Waka Consulting helps organizations connect fragmented data, define meaningful KPIs, improve data quality, build reliable reporting models, and turn business information into analysis people can use. Engagements can include analytics strategy, data integration, ETL or ELT, business intelligence, dashboards, forecasting, stakeholder workshops, training, and ongoing reporting improvement.
What makes analytics trustworthy and useful?
- Analytics strategy and KPI design with stakeholder workshops, metric definitions, reporting requirements, ownership, and a prioritized measurement roadmap
- Data preparation and BI engineering with source audits, integration, transformation, analytical modelling, quality checks, reconciliation, and refresh planning
- Dashboards, business intelligence, and decision support with role-specific reporting, analysis, forecasting where appropriate, training, and documented handover
From business questions to governed insight
A complete analytics service—not just another dashboard
Start with a focused data assessment or combine strategy, data preparation, business intelligence, and analysis into one decision-led engagement. The scope is organized around the questions your team needs to answer, the sources that can support them, and the owners responsible for acting on the result.
Analytics strategy and KPI design
Define what the organization needs to understand before selecting charts, platforms, or reporting formats.
- Stakeholder and decision workshops
- Analytics maturity and reporting review
- KPI framework, metric dictionary, and named owners
- Measurement roadmap and prioritized use cases
Data preparation and BI engineering
Connect and prepare source data so reporting logic is reproducible, testable, and maintainable.
- Database, API, platform, and spreadsheet source inventory
- ETL/ELT workflows and analytical data modelling
- Transformation rules and refresh planning
- Data-quality checks, reconciliation, and issue tracking
Dashboards and business intelligence
Create role-appropriate reporting that makes changes, exceptions, and drivers easier to investigate.
- Executive, operational, sales, and marketing reporting
- Drill-down views, filters, and comparison logic
- Shared metric definitions across dashboards and reports
- Access design, scheduled reporting, and owner handover
Analysis and decision support
Move beyond describing performance by investigating patterns, causes, scenarios, and possible next actions.
- Trend, variance, and root-cause analysis
- Funnel, cohort, and segment analysis
- Forecasting and scenario work when the data supports it
- Insight briefs, recommendations, and decision-review meetings
Designed forTeams that need one defensible path from raw data to a business decision
- Leaders working across conflicting reports
- Operations teams that need trusted performance metrics
- Growth teams improving funnels, cohorts, and attribution
- Organizations connecting data from several business systems
Decision-led analytics delivery
From business questions to validated reporting and insight
We begin with the decisions and users the analytics must support. Data access, quality, definitions, transformations, assumptions, and outputs are then reviewed with the people who understand the source systems and the people accountable for acting on the result.
01
Analytics workflowDefine, prepare, model, validate, explain
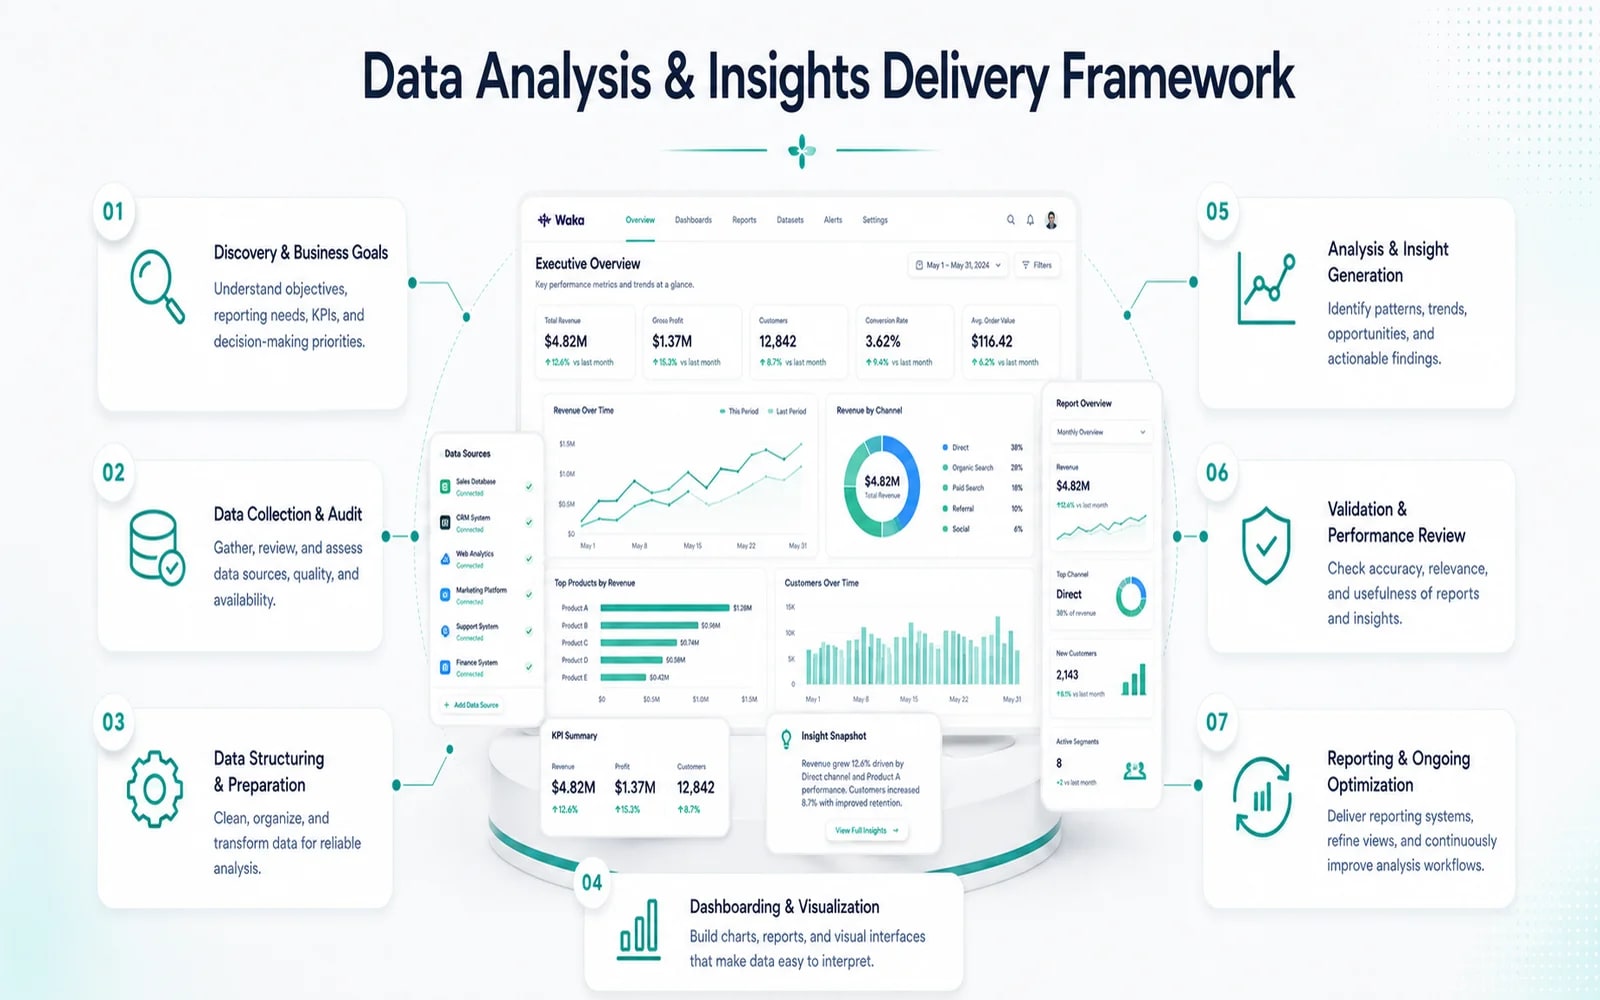
Define decisions and metrics
Run stakeholder workshops to define business questions, priority KPIs, audiences, decision cadence, success measures, and ownership before choosing a reporting format.
Audit sources and data quality
Inventory source systems, access, existing reports, definitions, refresh behavior, and known quality issues; document gaps before relying on the data.
Model, integrate, and analyze
Connect and transform the agreed sources, build reusable reporting logic, create analytical views, and investigate the priority questions with assumptions made visible.
Validate, train, and improve
Reconcile metrics with source owners, validate dashboard behavior and findings, train users, document upkeep, and agree how quality and usefulness will be reviewed over time.
Analytics people can defend
Clear definitions, traceable logic, and decisions people own
A polished chart is not useful when teams disagree about the number underneath it. We connect metric definitions, source data, transformation logic, quality checks, analytical assumptions, and stakeholder review so each output has a clear purpose and an accountable owner.
Data and analytics practices
SQLETL/ELTData modellingData-quality checksBI dashboardsKPI frameworksForecasting and analysisAPI integrations
02
Working principlesTrust before scale
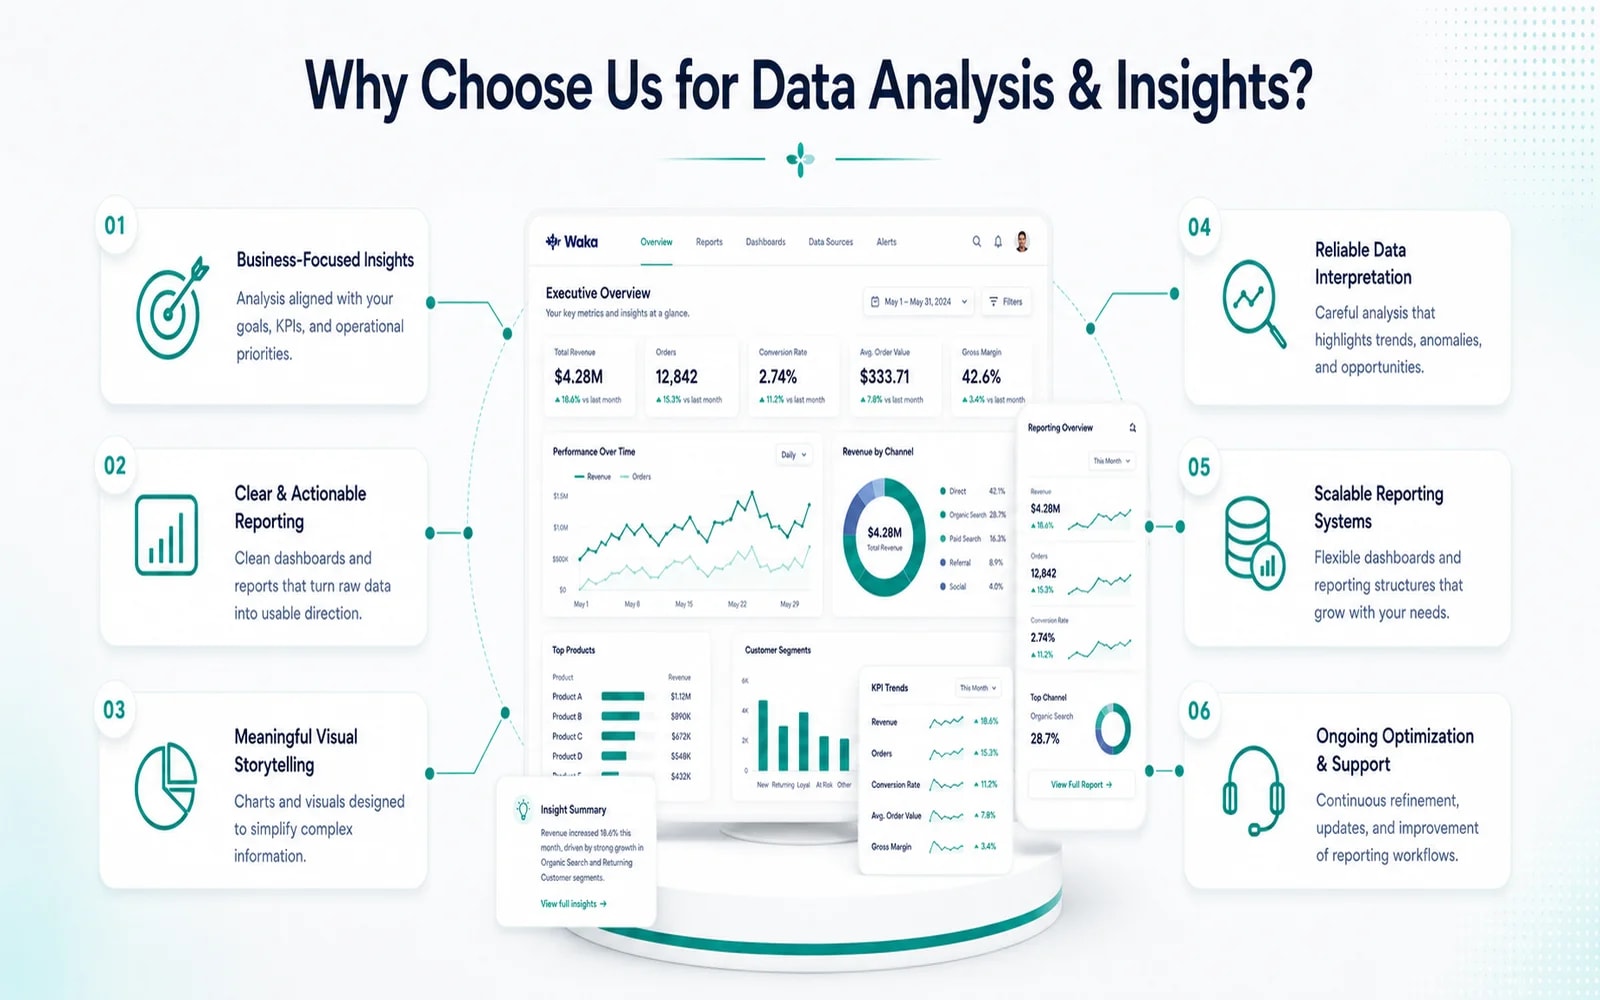
Decisions before visuals
Every metric and analytical view starts with a user, a business question, a decision cadence, and a defined action when the signal changes.
Evidence behind every metric
Definitions, sources, transformations, exclusions, refresh timing, quality checks, and known limitations are documented so teams can understand what a number represents.
Handover that keeps working
Owners receive training, metric documentation, refresh and issue guidance, and a practical review cadence instead of an unexplained dashboard they cannot maintain.
Questions, answered
Data Analytics & Insights FAQ
Direct answers about data quality, KPI design, integrations, business intelligence, analysis, forecasting, and handover.
Ask about your projectWhat can a Data Analytics & Insights engagement include?
The scope can include analytics strategy, stakeholder workshops, KPI and metric design, source-system audits, data-quality assessment, data integration, ETL or ELT workflows, analytical data models, BI dashboards, recurring reports, trend and variance analysis, segmentation, forecasting, documentation, training, and ongoing improvement. We confirm the exact questions, sources, users, and deliverables before work begins.
How is this different from Internal Dashboard & Automation?
Data Analytics & Insights focuses on trusted data, KPI logic, analytical models, reporting, and decision support. Internal Dashboard & Automation focuses on operational software where users manage records, queues, approvals, notifications, permissions, and workflow actions. An analytics engagement may produce a dashboard, but it does not automatically become an internal operating system.
How do you decide which KPIs belong in a dashboard?
We begin with the decisions each audience needs to make. A useful KPI has a clear definition, source, calculation, refresh frequency, owner, target or comparison context, and expected action when it changes. Metrics without a decision or accountable owner are challenged before they become permanent reporting clutter.
What happens when our source data is incomplete or inconsistent?
We document the issue, assess its effect on the required metrics, reconcile representative records with source owners, and define practical validation or remediation rules. Outputs disclose known gaps and assumptions rather than presenting unreliable data with false precision.
Can you combine databases, APIs, platforms, and spreadsheets?
Yes, when access and source quality permit it. We map each source, identify keys and ownership, define transformations, and choose an appropriate integration and refresh approach. The goal is reusable reporting logic without hiding unresolved differences between systems.
Do you provide forecasting and advanced analysis?
Forecasting, segmentation, funnel analysis, cohort analysis, anomaly investigation, and scenario work can be included when the available data and business context support them. Methods, assumptions, validation limits, and confidence should be explained; an analytical model cannot guarantee a business outcome or eliminate uncertainty.
Which analytics tools will you use?
Tool selection follows the sources, scale, refresh needs, access model, analytical requirements, internal skills, and maintenance budget. Depending on the approved solution, the work may use SQL, APIs, ETL or ELT workflows, analytical data models, data-quality checks, BI reporting, and fit-for-purpose analysis methods rather than forcing every engagement into one platform.
What do we receive at handover?
Typical outputs include the source and metric map, documented calculations, data-quality findings, reporting or analytical models, validated dashboards or reports, insight briefs, known assumptions and limitations, owner guidance, training, and a plan for refreshes, issue handling, and future improvement.
Featured Insights
Stories of Digital Transformation Across Services and Industries
From Idea to Impact






Start with the decision
Turn disconnected data into a trusted analytics plan.
Tell us which decisions are difficult today, where the data lives, and who relies on the answer. We will help define the right assessment, reporting foundation, and next step without promising outcomes the data cannot support.