
Designing an Analytics Dashboard for Faster Operational Scanning
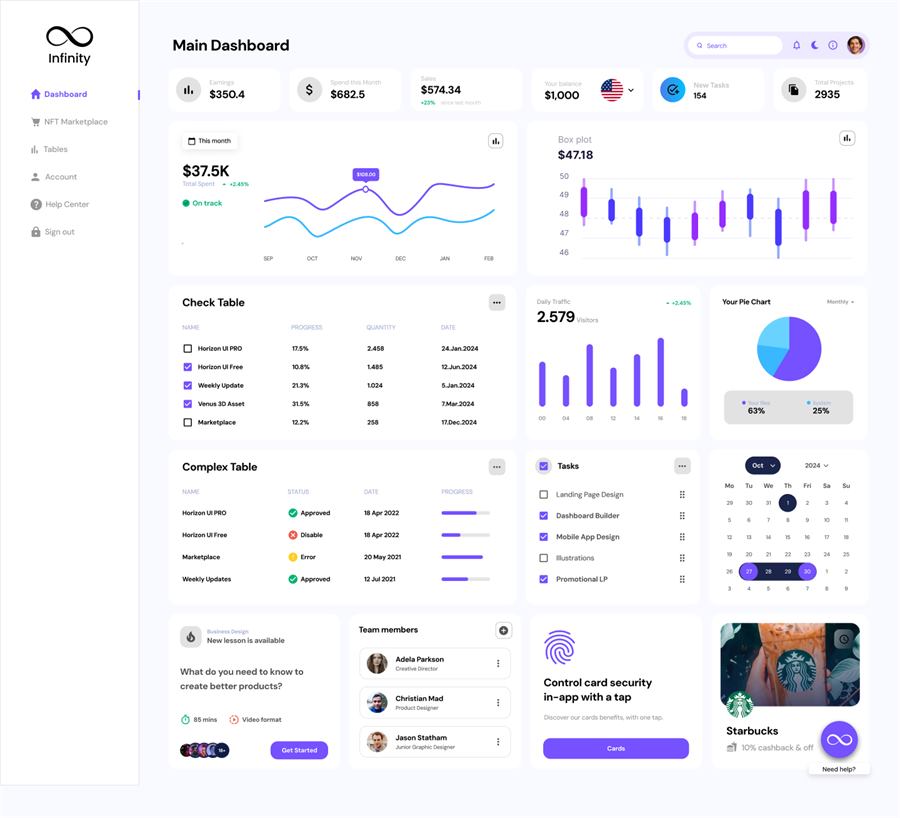
The Infinity dashboard concept explores how a dense operational view can help a user scan performance, notice exceptions, and move into action without giving every metric equal visual weight.
- Project type
- Dashboard concept
- Primary audience
- Operational teams
- Waka's role
- Information and UI design
- Outcome
- Modular analytics view
Turning dashboard density into a deliberate reading order
Dashboards often become collections of every metric and widget a team might request. The result may look comprehensive while making it difficult to understand what changed, what matters, and what action should happen next.
Infinity organizes the interface into layers: headline signals for orientation, trends for diagnosis, and operational modules for action. Reusable cards create consistency, but size and placement still communicate priority.
Showing broad operational context without flattening every signal
A useful dashboard must support rapid scanning while preserving enough detail for investigation. Metrics, charts, tables, tasks, people, and time all compete for attention, so the information architecture has to create a purposeful reading sequence.
Make the most important signals recognizable in seconds.
Separate orientation metrics from diagnostic detail.
Connect insight areas to tasks or deeper records.
Use a reusable card system without making every module look equally important.
The choices that shaped the product direction
The concept was developed as a connected system. Each decision supports the same outcome: helping a learner understand what to do without unnecessary explanation.
Create a top-level signal layer
Headline metrics establish immediate context before users move into charts, tables, or detailed modules.
Orientation comes firstUse visual weight to express priority
Larger trend areas and stronger grouping communicate which information deserves attention instead of relying on color alone.
Hierarchy is not decorationKeep operational modules actionable
Tables, task lists, calendars, and team cards should lead toward records or work rather than ending as passive summaries.
Insight should lead to actionBuild modular consistency
Shared spacing, labels, states, and card behavior make new modules easier to add without creating a visually unrelated interface.
A system supports growthA four-stage dashboard reading model
The interface supports the sequence from rapid orientation to a useful operational action.
Scan
Recognize headline performance, status, and unusual change.
Diagnose
Use trends and comparisons to understand why attention is needed.
Act
Open the relevant record, task, workflow, or owner.
Review
Return later to confirm whether the situation changed.
A modular information system for analytics and operations
- Dashboard hierarchy
- Metric-card system
- Chart and table direction
- Task and calendar modules
- Responsive priority rules
- Reusable UI language
A dense dashboard concept with a clearer scan-to-action path
The result demonstrates how multiple operational modules can coexist while maintaining hierarchy, consistency, and a route from signal to action.
Headline context separated from diagnostic detail
Reusable modules with differentiated visual priority
Operational information connected to tasks, records, and time
What product teams can reuse from this work
- A dashboard should answer what needs attention before showing everything available.
- Reusable cards still require clear differences in priority.
- Operational dashboards should connect signals to records and actions.
- Naming, definitions, and ownership are as important as chart selection.
About the project and its evidence
Is Infinity the same project as Signal OS?
The local visual is branded Infinity, while historical site copy used Signal OS. This case study follows the visible asset and does not claim they are the same production product.
Is this dashboard connected to live data?
The available work documents an interface concept. No production integration or live operational result is claimed.
What should be validated before development?
Validate metric definitions, role priorities, scan order, exception handling, drill-down behavior, accessibility, and whether each module supports a real decision or workflow.
Build dashboards around decisions, not widget counts.
Waka connects product thinking, interface design, development, and launch support in one delivery flow.